Most Common SQL Concepts for A Data Scientist
In order to work with real examples that you can follow along, first we are going to create two temporary tables named “people” and “salary” and then these two temporary tables will be used for the rest of the exercise. The benefit of this approach is that you can copy and paste the table creation part and then practice along the following steps to maximize the learning opportunity. Please note, you do not need to understand the table creation part of the work at this point. The part you need to understand starts after that.
So, just go ahead, copy and paste the below into your favorite SQL tool and hit run.
1. Basics
Now let’s take a look at what we created in the two temporary tables above. I am going to frame these as questions and answers so that you can also take a stab at solving each question first, before looking at the answer that I have provided. What I have provided is just one way to solve these questions — usually there is more than one right way to get to the same answer.
Q1: Grab all the data available in table people.
A1:
In general, I will first provide the answers and then will explain what happened and how different SQL concepts work, either under the same question or the one following. For example, Q2 will explain what happened in Q1.
SELECT
 *
FROM
 people;
Results:

And for future reference, this is what table salary looks like, using the following:
SELECT
 *
FROM
 salary;

Pro Tip: At this point, I suggest you take a snapshot of these two tables — I’ve added instructions below on how to take a snapshot. You will want to refer back to the tables to write queries going forward and scrolling up and down in this post to find these two tables won’t be fun. For convenience, I have included instructions on how to take a snapshot on Mac and Windows:
- Mac Users — Press and hold these three keys together: Shift, Command, and 4 and then select the area for the snapshot. If you do not wish to manually select the snapshot area, Pressing Shift, Command and 3 together will do a print screen.
- Windows Users — Press these three keys together: Windows Key + Shift + S and then create a snapshot using the Snip and Sketch tool (I am on a Mac so this is based on a Google search — hope it works).
Q2: Explain what happened in the previous query.
A2: SELECT statement is used to select data from a given database (i.e. table). FROM is used to indicate which database the data should be selected from (“people” in this example). And finally * simply says select everything from that database.
Q3: Show me only the data from the following columns: ['name', 'gender', 'job_title'].
A3:
SELECT
 name,
 gender,
 job_title
FROM
 people;
Results:

This one was straightforward — we can indicate explicitly was columns are to be selected.
Q4: Which individuals work in New York?
A4:
SELECT
 name
FROM
 people
WHERE
 location = 'new_york';
Results:

As demonstrated in this example, we can filter the results using WHERE.
3. Aggregations
Aggregations help us do some basic analytics on the data. Examples include COUNT(), MAX(), MIN(), AVG(), and SUM().
Q5: How many individuals live either in Seattle or Phonenix?
A5:
SELECT
 count(person_id)
FROM
 people
WHERE
 location IN ('seattle', 'phoenix');
Results:

Q6: How many individuals live in each of the cities?
A6:
SELECT
 location,
 count(person_id)
FROM
 people
GROUP BY
 location;
Results:
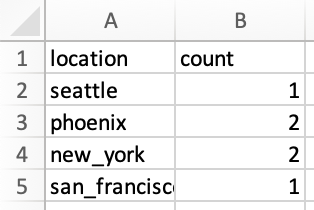
We already knew what COUNT() this from the previous question but now there is also a new concept at the end of the query. GROUP BY statement groups rows of data with the same values together and is used with aggregation functions, such as COUNT(), MAX(), MIN(), AVG(), and SUM().
Q7: What is the total salaries in Phoenix and New York?
A7:
SELECT
 location,
 SUM(salary) AS total_salary
FROM
 people
WHERE
 location = 'phoenix'
 OR location = 'new_york'
GROUP BY
 location;
Results:
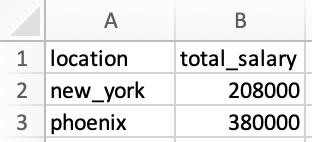
There are two new learnings in this example. First one is that in this example, we assigned an alias to the SUM() column and the resulting column is now named total_salary. Had we not done so, the column would have looked as below:
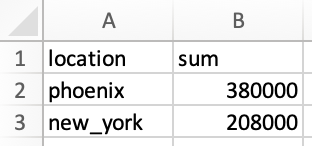
Second learning is an alternative approach. Note that in the WHERE, we are using OR, which determines location can either be phoenix or new_york. Alternatively, we could have used location IN ('phoenix', 'new_york'), similar to the approach we used in Q5. This does not change the results and is simply an alternative approach.
4. Joins
This is one of the most useful features. It. helps to visualize the data when trying to understand the queries. Let’s look at an example first and then I will explain what is happening.
Q8: Show me the individual names, their locations and salaries, along with the average salary in each location.
A8: Note this is a new type of question that we had not tackled before. Individual names, locations and their salaries are available in table people while average salary by location is available in table salary. What we need is to JOIN these two tables together, which is possible because both tables have the name of the cities in common (although the columns are named location in people and city in salary). How we structure this is as follows:
SELECT
 p.name,
 p.location,
 p.salary,
 s.average_salary
FROM
 people p
 LEFT JOIN salary s ON p.location = s.city;
Results:

So what exactly happened? Let’s look at the join more closely:
FROM
 people p
 LEFT JOIN salary s ON p.location = s.city
The above says that look at table people and then join it to table salary. Then we need to indicate columns in each table that share the same values (imagine stitching these two tables together only where there are common values in those two particular columns). The columns with mutual values are location from people and city from salary. Lastly, we are using the concept of aliases here. For example, table people now has an alias of p, while table salary has an alias of s. When we want to indicate column location from people, we could either indicate that as people.location or p.location. The same applies to how we indicate column city from salary as s.city. Note that the structure is always as table_name.column_name. Lastly, we used a LEFT JOIN in this example. Below I will discuss what that means and what other ways are there to join tables.
As mentioned, we used a LEFT JOIN in this example. It is helpful to have the below picture in mind when thinking about how JOIN works.

Below are some of the most common JOINtypes:
JOINorINNER JOIN: Returns the data that have matching values in both left and right tables.LEFT JOINorLEFT OUTER JOIN:Returns the data from the left table and all the matched data from the right table.RIGHT JOINorRIGHT OUTER JOIN: This is the flip side of theLEFT JOIN. It returns the data from the right table and all the matched data from the left table.FULL JOINorFULL OUTER JOIN: Returns all the data from either the left or right table when there is a match between the two
5. Conditionals
Q9: Create a new column in people that breaks down the job titles into tech and non-tech. Only return names, job titles, the new category named as job_group and salaries.
A9: In order to answer this question, first we need to see what unique job titles are available in people using the following query:
SELECT
 DISTINCT job_title
FROM
 people;
Note that DISTINCT is the statement that was added to SELECT to only return unique (or distinct) values in that column, as demonstrated in the results below:
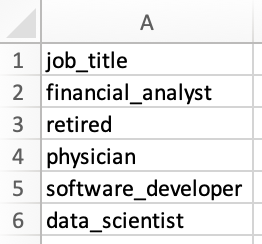
Now that we know what job titles exist, we can break them down into tech and non-tech as instructed. For this exercise, use your best judgement to determine what role is tech and what is non-tech — important part is to learn how to implement this logic in the query. For example, financial_analyst is a non-tech role, while data_scientist is a tech role. The following query does just that:
SELECT
 name,
 job_title,
 CASE
  WHEN job_title IN ('software_developer', 'data_scientist') THEN 'tech'
  WHEN job_title IN ('financial_analyst', 'physician') THEN 'non-tech'
  ELSE job_title
 END AS job_group,
 salary
FROM
 people;
Results:

Let’s talk about how CASE expression works by looking more closely at what we did for this question:
CASE
  WHEN job_title IN ('software_developer', 'data_scientist') THEN 'tech'
  WHEN job_title IN ('financial_analyst', 'physician') THEN 'non-tech'
  ELSE job_title
 END AS job_group,
In order to implement this logic, we first start with theCASE expression and then identify the conditions, using WHEN, such as:
WHEN job_title IN ('software_developer', 'data_scientist') THEN 'tech'
The above script, first looks at the column job_title, and if the value of that column for any row is either software_developer or data_scientist, it then outputs tech. The same logic applies for the non-tech category.
Then there is ELSE job_title. This clause says that if a value is encountered in the column that was not covered under the WHEN conditions above, return the value that exists in the column job_title. For example, if we had a row in column job_title with the value of chef, since chef was not among the ones that we had included in the WHEN conditions (i.e. software_developer, data_scientist, financial_analyst, and physician), then this clause would return the original value in column job_title, which was chef.
Last part of the script is END AS job_group. CASE expression finishes with an END and the AS job_group is the alias that is given to the resulting column. That is why the column is named job_group in the results table.
Pro Tip: The order of the conditional statements, starting with WHEN, is important. Once a condition is true, it will stop reading the rest of the conditions and returns the result. If none of the conditions is met, it returns the value in the ELSE clause.
Q10: Which job_group makes more money on average? Order the results from the highest to the lowest job_group.
A10: I will include two approaches to answer this question, each one will introduce new concepts. First I am going to cover an approach to show how to use FROM directly on an output of a query and then I will cover a different approach to demonstrate application of WITH clause.
Approach 1:
SELECT
 job_group,
 AVG(salary) AS average_salary
FROM
 (
  SELECT
   person_id,
   CASE
    WHEN job_title IN ('software_developer', 'data_scientist') THEN 'tech'
    WHEN job_title IN ('financial_analyst', 'physician') THEN 'non-tech'
    ELSE job_title
   END AS job_group,
   salary
  FROM
   people
 )
GROUP BY
 job_group
ORDER BY
 average_salary DESC;
Results:
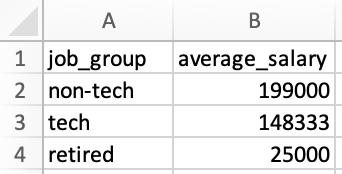
So what exactly happened? In the past we always included the name of a table after FROM, but the new concept here is that we can also include an inner query instead of the name of the table. What happens is that the inner query after the FROM is run first and then the results are used as a temporary table to select data from in the outer query.
Approach 2:
I will start by including the query used in this approach and then will explain each of the steps within the query. Let’s start with the query first:
WITH count_table AS(
 SELECT
  CASE
   WHEN job_title IN ('software_developer', 'data_scientist') THEN 'tech'
   WHEN job_title IN ('financial_analyst', 'physician') THEN 'non-tech'
   ELSE job_title
  END AS job_group,
  count(person_id) as total_count
 FROM
  people
 GROUP BY
  1
),
total_salary_table AS(
 SELECT
  CASE
   WHEN job_title IN ('software_developer', 'data_scientist') THEN 'tech'
   WHEN job_title IN ('financial_analyst', 'physician') THEN 'non-tech'
   ELSE job_title
  END AS job_group,
  SUM(salary) as total_salary
 FROM
  people
 GROUP BY
  1
)
SELECT
 ct.job_group,
 tst.total_salary / ct.total_count as average_salary
FROM
 count_table ct
 INNER JOIN total_salary_table tst ON ct.job_group = tst.job_group
ORDER BY
 average_salary DESC;
Now let’s look more closely at what happened.
First we will create a temporary table using the WITH clause, named count_table. This temporary table shows how many individuals are within each job_group, as shown below:

Next we will create a second temporary table named total_salary_table that shows the total salary for each job_group, as shown below:
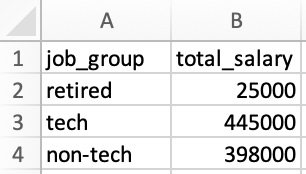
Now that we have these two tables, we can join them together to find the average salary for each job_group, as follows:

Results here match the results from approach 1 as expected.
6. Window Functions
These functions are more challenging to visualize initially so do not be disappointed if you do not get it right away. Go through a few examples and you will start understanding them much better. We usually include these in our interviews so I do recommend that you understand and practice these.
Window functions generally perform a calculation across a set of table rows that are somehow related. In other words, they are somehow similar to aggregations with some caveats. Unlike aggregations, window functions do not cause rows to be grouped together. This will become clearer with examples.
A few examples of window functions are: COUNT(), AVG(), SUM() , ROW_NUMBER(), RANK(), DENSE_RANK(), LAG, and LEAD and they are structured as follows:
window_function(column_name) OVER (
 PARTITION BY
  column_name
 ORDER BY
  column_name ROWS BETWEEN UNBOUNDED PRECEDING
  AND UNBOUNDED FOLLOWING
) AS output_alias;
Example above shows the most common elements of how window functions are structured but not all of them are necessary. I know so far this does not make sense so let’s look at some of them in practice to better understand them.
Q11: Create a rank of the salaries overall and also by gender from highest to the lowest salary.
A11:
SELECT
 name,
 gender,
 salary,
 RANK() OVER(
  ORDER BY
   salary DESC
 ) AS salary_rank_overall,
 RANK() OVER(
  PARTITION BY gender
  ORDER BY
   salary DESC
 ) AS salary_rank_by_gender
FROM
 people
ORDER BY
 salary_rank_overall,
 salary_rank_by_gender;
Results:

As you can see in the results, using RANK() window function, we were able to rank salaries both from an overall perspective and also within each of the male or female categories. Inside the OVER(), we indicated that we want the ranking to be broken down (or “partitioned”) by gender and also to be sorted by salary from highest to the lowest by adding ORDER BY salary DESC.
Q12: Create a running sum of each salary both overall (i.e. sum at row 2 should be row 1 + row 2, sum at row 3 should be sum of row 1 + row 2 + row 3, and so forth) and also by gender, ordered by age (from older to younger). Also include a column that shows the total salary at each row.
A12:
SELECT
 name,
 gender,
 birth_year,
 salary,
 SUM(salary) OVER(
  ORDER BY
   birth_year ROWS between UNBOUNDED PRECEDING
   And CURRENT ROW
 ) AS running_total_salary_overall,
 SUM(salary) OVER(
  PARTITION BY gender
  ORDER BY
   birth_year ROWS between UNBOUNDED PRECEDING
   And CURRENT ROW
 ) AS running_total_salary_by_gender,
 SUM(salary) OVER(
  ORDER BY
   birth_year ROWS between UNBOUNDED PRECEDING
   And UNBOUNDED FOLLOWING
 ) AS total_salary
FROM
 people
ORDER BY
 running_total_salary_overall,
 running_total_salary_by_gender;
Results:

Once you go through the explanations below and compare them to the results, I am sure you will also appreciate how powerful window functions are.
This one used some new statements so let’s look at them more closely. Let’s look at the following first:
SUM(salary) OVER(
  ORDER BY
   birth_year ROWS between UNBOUNDED PRECEDING
   And CURRENT ROW
 ) AS running_total_salary_overall,
SUM(salary) is simply adding up the salaries but how the salaries should be added up is the more interesting part and is instructed in the OVER() statement. First the salaries are sorted by the year individuals were born from lowest to the highest, as stated in ORDER BY birth_year, (absence of DESC tells us it is in an ascending order). Then ROWS tells how the SUM() should be applied to these rows of data. In this case, summation is applied to all the rows before each row (UNBOUNDED PRECEDING) up to and including the row itself (CURRENT ROW).
Now what if we wanted the summation at each row to include everything before and also everything after that specific row? That can be accomplished by the following:
ROWS between UNBOUNDED PRECEDING
   And UNBOUNDED FOLLOWING
This structure was used to calculate the total_salary in the following part of the query and you can see in the results section:
SUM(salary) OVER(
  ORDER BY
   birth_year ROWS between UNBOUNDED PRECEDING
   And UNBOUNDED FOLLOWING
 ) AS total_salary
Since for each row we wanted to have the summation of all the rows before and after a given row, essentially we asked to see the total summation of that column shown at each row under total_salary, which was the same value of 868,000 for every row.
8. Miscellaneous — UNION Operator, Null Handling and Date Management
So far we covered some of the more common concepts that can help you write your own queries. In this part, I am going to cover a few additional topics that can also help you in interviews.
Similar to last time, let’s first create two new tables named misc_part1 and misc_part2 and then go through the concepts. For now, just copy, paste and run the below script to create the temporary tables for this part of the exercise.
Bonus Point (Optional): Now that you are more familiar with different SQL concepts, take a look at what you copy and paste and see if you can follow the logic. You can see that we first define a table, then specify columns within the table and the data type associated with each column, followed by adding values for each column (in the format of a row of values). That’s it! Now you can create your own temporary tables and start retrieving data from them!
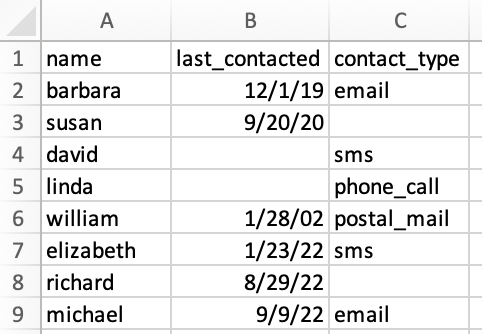
Now let’s see what the tables look like. I am going to use the following to look at mist_part1:
SELECT
 *
FROM
 misc_part1:
Results:
and then will use the following to see misc_part2:
SELECT
 *
FROM
 misc_part2;
Results:

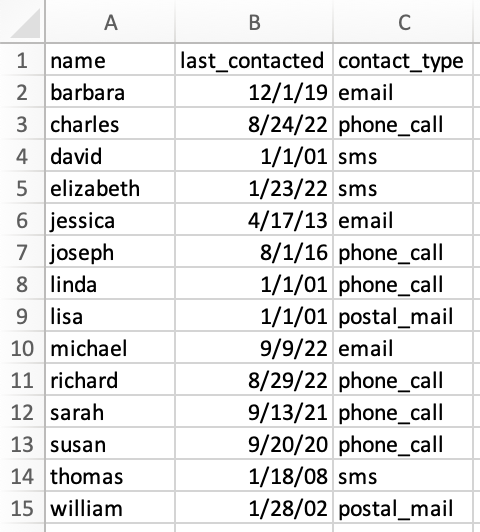
We can think of these two tables as some marketing data about the last time clients were contacted and also how they were contacted, such as via email, phone call, etc. There are three observations just by looking at the data:
- Both tables have the same column names, so maybe there is an opportunity to combine them as part of our exercise, which we will further explore under
UNION. - Some of the values are missing, which was not the case in
peopleandsalarytables. For example, looking atmisc_part2, cellsB5andB6are empty. There are also some missing values inmisc_part1. We will discuss null handling. - Both tables include a date format column, which we did not have in
peopleandsalarytables. We will use these values for some date manipulation.
Similar to last time, feel free to snapshot these two tables for your reference and then let’s continue with the same question and answer format to cover some new concepts.
8.1. UNION Operator
Q13: I see that both tables include the same columns. Can you combine them into one table? Sort the results by name and also identify which row belongs to which table.
A13: Remember that we started with two tables, each of them include 8 rows of data (excluding the headers) so we expect the combined table to include 16 rows of data (excluding the headers).
This can be done using UNION ALL in the following format:
SELECT
 *,
 1 AS misc_table_number
FROM
 misc_part1
UNION ALL
SELECT
 *,
 2 AS misc_table_number
FROM
 misc_part2
ORDER BY
 name;
Results:

Results include 16 rows of data (excluding the headers) as we expected. Let’s talk about what happened.
UNION ALL operator puts the data from each of the queries and stacks them on top of each other. There are a few conditions that need to be met for this to work properly:
- Every
SELECTwithin theUNION ALLoperator must have the same number of columns. For example, in our exercise each table includes 4 columns. - Corresponding columns from each
SELECTstatement must have the same data type. For example,namein both of tables are inVARCHAR(30)data type, orlast_contactedin both tables are inDATEdata type. - Columns of each of the
SELECTstatements must be in the same order. In other words, the order in both tables in our example tables should bename,last_contacted,contact_type,misc_table_number. This condition was also met in our example and that is why we were able to useUNION ALL.
Q14: Looking at the results of Q13, it looks like both tables included the same data for david and elizabeth. Can you create the same table but only include unique rows (i.e. de-dupe the results)? No need to show which table rows belong to.
A14: This can easily be done by using UNION, instead of UNION ALL. In other words, UNION only selects distinct values, while UNION ALL selects all the values. The query is as follows:
SELECT
 *
FROM
 misc_part1
UNION
SELECT
 *
FROM
 misc_part2
ORDER BY
 name;
Results:
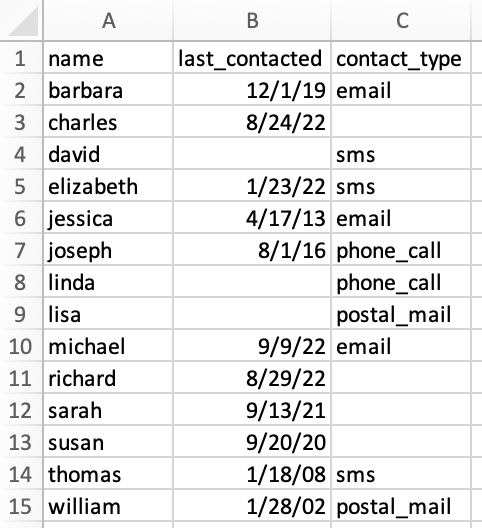
As expected, results now only include distinct rows and the total number of rows is now 14 (excluding headers), instead of 16 that we saw in Q13.
8.2. Null Handling
Q15: Create a temporary table named combined_table that includes distinct rows of the combined tables (similar to Q14). Where last_contacted value is missing, enter the value as 1901-01-01. We also know that contact_type that is missing is phone_call so fill those in as well.
A15:
WITH combined_table as (
 SELECT
  *
 FROM
  misc_part1
 UNION
 SELECT
  *
 FROM
  misc_part2
 ORDER BY
  name
)
SELECT
 name,
 NVL(last_contacted, '1901-01-01') as last_contacted,
 COALESCE(contact_type, 'phone_call') AS contact_type
FROM
 combined_table;
Results:
Results are as we expected so let’s talk about what happened.
There are two null functions that we used in this exercise and for our purposes they are both similar. They both return an alternative value when an expression is NULL. I wanted to use both to showcase them both but you can choose to use either one. Let’s look at them more closely:
NVL(last_contacted, '1901-01-01') as last_contacted,
COALESCE(contact_type, 'phone_call') AS contact_type
The first one is saying that when encountering NULL in column last_contacted, replace that with 1901-01-01. Similarly, the second one is saying that when encountering NULL in column contact_type, replace that with phone_call, as instructed in the question.
Pro Tip: Depending on the SQL environment, statements can slightly vary but concepts remain the same. For example, COALESCE() is used across MySQL, SQL Server, Oracle, and MS Access, while NVL() mainly works with Oracle.
8.3. Date Management
Q16: Starting with the combined_table, create separate columns for year, quarter, month and date of the last time individuals were contacted, where such a date is available.
A16: Let’s look at the structure and results first and then talk through it.
WITH combined_table as (
 SELECT
  *
 FROM
  misc_part1
 UNION
 SELECT
  *
 FROM
  misc_part2
 ORDER BY
  name
)
SELECT
 name,
 last_contacted,
 DATE_PART(year, last_contacted) AS year_contacted,
 DATE_PART(quarter, last_contacted) AS quarter_contacted,
 DATE_PART(month, last_contacted) AS month_contacted,
 DATE_PART(day, last_contacted) AS day_contacted,
 contact_type
FROM
 combined_table
WHERE
 last_contacted IS NOT NULL;
Results:

There are two new concepts to cover in this exercise. First one is to extract one specific part (e.g. year, quarter, month, or day) from a date, which can be implemented as follows:
DATE_PART(year, last_contacted) AS year_contacted,
Idea is simple. year identifies which part of the date is to be extracted and then it is followed by the column name where the original date exists, which is last_contacted in this example.
Second concept is to filter out the rows with NULL values, which was accomplished using the following:
WHERE
 last_contacted IS NOT NULL
Pro Tip: In SQL Server, instead of DATE_PART(), one uses DATEPART().
Section 3 — Cheat Sheet
I have included the cheat sheet that I had developed for myself here. Before you start using it, I do have two parting recommendations about this and other cheat sheets:
- When possible, build your own cheat sheet over time, instead of relying on a prepared cheat sheet. You will learn much more when you go through creating and updating it on your own, compared to one that is shared with you.
- If you do not have the time to create your own cheat sheet, take an existing cheat sheet and make it your own. What I mean is that start with the existing cheat sheet but add to it, revise it, edit it and at some point it will become “your” cheat sheet and you will continue to learn along the way.
Summary
In this post, we started with discussing the importance of data retrieval using SQL for a Data Scientist. Then we moved on to learning the most common SQL concepts with the help of 16 practice questions and answers. Finally a reference sheet for some of the more common concepts in SQL was provided for future reference.
Thanks for Reading!
This post took me about 9.5 hours to research and prepare. If you found it helpful, please follow me on Medium and support me in getting to 1,000 followers!


